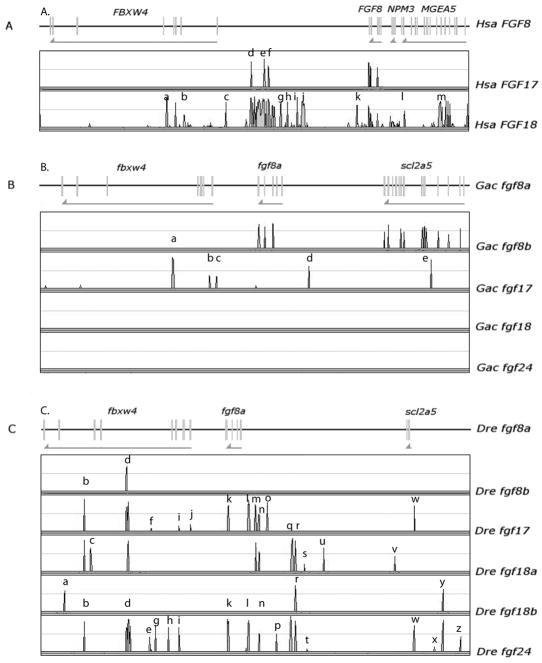
Figure 10.
Distribution of CNEs among FgfD paralogs in human (A), stickleback (B) and zebrafish (C). The higher density of CNEs among human paralogs is probably the result of the R3 genome duplication in teleosts with subsequent relaxed selection and partitioning of regulatory elements (Force et al., ‘99). The reference sequence is indicated at the top. The position of exons is indicated along the toop. For each conservation plot, the top line represents 100% conservation with the reference sequence, and the bottom line indicates 50% conservation. Grey arrows show gene orientation. Lower case letters indicate peaks mentioned in the text.

