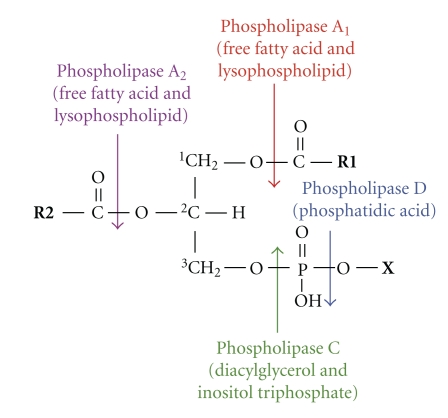
Figure 1.
Hydrolysis of phospholipids by phospholipases. Arrows indicate the sites of attack for hydrolytic cleavage of phospholipases type A1, A2, C, and D. The main products generated by their action are also shown. R1/R2: free fatty acids in sn-1 or sn-2 positions; X: choline, ethanolamine, serine, inositol, and so forth.

