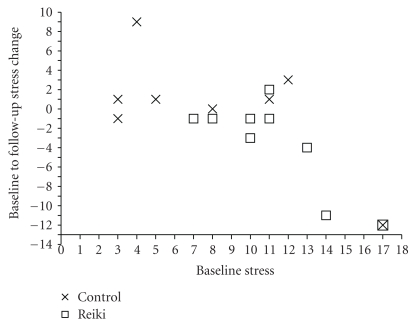
Figure 4.
Scatter plot showing the Baseline to Follow-up Stress changes of the High-Mood Reiki and Control participants plotted against their Baseline scores, where the change scores of Reiki participants are denoted by boxes and those of Control participants by crosses, and a negative change corresponds to an improvement.

