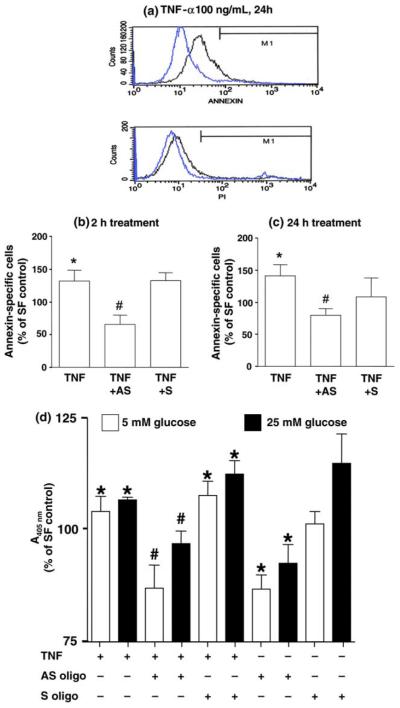
Fig. 3.
Anti-sense IGFBP-3 oligo inhibited TNF-α-induced apoptosis by FACS. (a) Cells were incubated with 100 ng/mL TNF-α (black lines) or SFM control (blue lines) containing 5 mM glucose for 24 h. Annexin (upper panel) reflects apoptosis, and PI (lower panel) reflects necrosis. Cells pre-treated with or without sense or anti-sense oligo for 30 min, then 100 ng/mL TNF-α for 2 h (b) or 24 h (c). Data presented in the histograms are expressed as percentage of SF control with means ± SE (n = 3; *p < 0.05 vs. SF control; #p < 0.05 vs. TNF-α). (d) DNA fragmentation ELISA: cells pre-treated with or without oligo before 24 h of TNF-α under SFM with 5 or 25 mM glucose. Data represented percentage of SF control, with histogram depicting means ± SE (n = 8; *p < 0.05 vs. SF control; #p < 0.05 vs. TNF-α by ANOVA).

