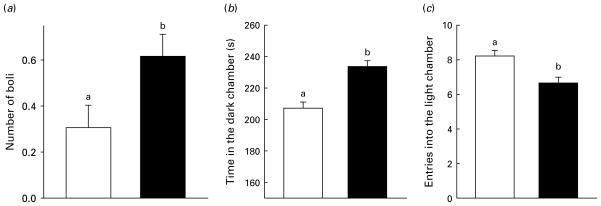
Fig. 6.
Mean+S.E.M. of number of (a) boli, (b) time in the dark chamber, and (c) entries into the light chamber as a function of treatment group in the light/dark box test. For a given plot, means with different letters differ. Data are collapsed across drug treatments to describe main effect of predator stress (□, handled control, n=120; ■, predator-stressed, n=120).

