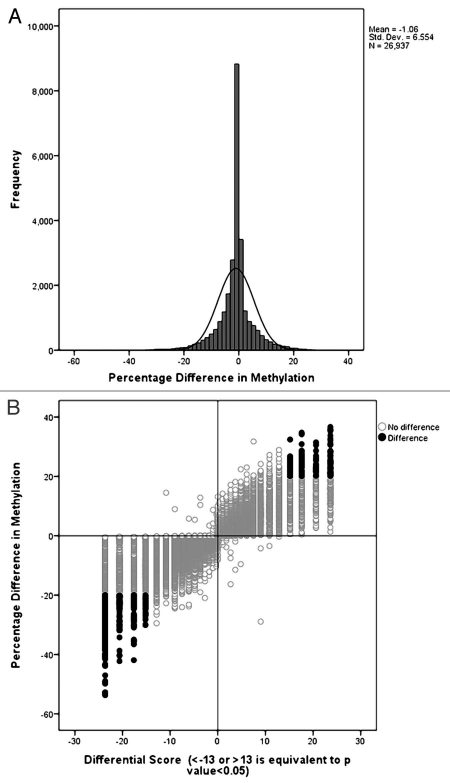
Figure 3.
Selection criteria of Differentially Methylated CpG Dinucleotides. (A) The distribution of DNA methylation differences is narrow between cytotrophoblasts and fibroblasts demonstrating that large methylation differences between the two cell types are rare. (B) The scatter plot shows the distribution of differences in methylation as a differential score where a value of >13 or <-13 is equal to a p value of <0.05. The probes with a significant difference in methylation higher than 20% are shown in black. Positive differences (higher cytotrophoblast methylation) in the left upper quadrant and negative differences (higher fibroblast methylation) in the right lower quadrant.

