Figure 4.
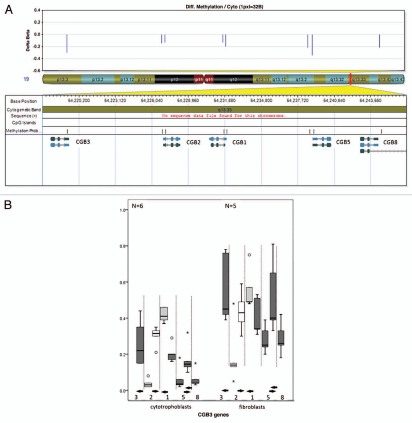
DNA methylation values of the CGB genes in cytotrophoblasts and fibroblasts. (A) CGB genes map to chromosome 19q (middle). At each CpG site there is lower methylation in cytotrophoblasts than in fibroblasts (top). The chromosome band containing the CGB genes is magnified (UCSC genome browser build 36.1 annotation) to illustrate the CpG islands and CpG probes as they relate to the genes (bottom). Six of eight probes show a reduction in methylation, five of these reach our stringent cut-off criteria: CGB3 (probe 1), CGB1, CGB5 and CGB8 (probes 5–8). (B) Box-plot of the methylation values of CpG sites mapping to the CGB genes. Each of the eight CpG probes mapping to CGB genes are represented. The methylation level is depicted on the y-axis. The x-axis shows the CGB gene probes in the order in which they appear in the genome (proximal to distal) but is not to scale. Some genes have two probes and are separated by the interrupted vertical lines. The solid horizontal arrows represent the TSS and point in the direction of transcription. Two CpG probes show no difference in methylation (white box) between the cytotrophoblasts (left) and fibroblasts (right). Probes are less methylated in cytotrophoblasts (left) then in fibroblasts (right). Here each of the array probes mapping to the region are represented by a boxplot. The statistically significant different probes (Wilcoxon rank-sum test, p < 0.05) reaching or passing the 20% cut-off are represented by a dark gray bar while the clear gray bar corresponds to the probe that has <20% difference in methylation but remains statistically significant.

