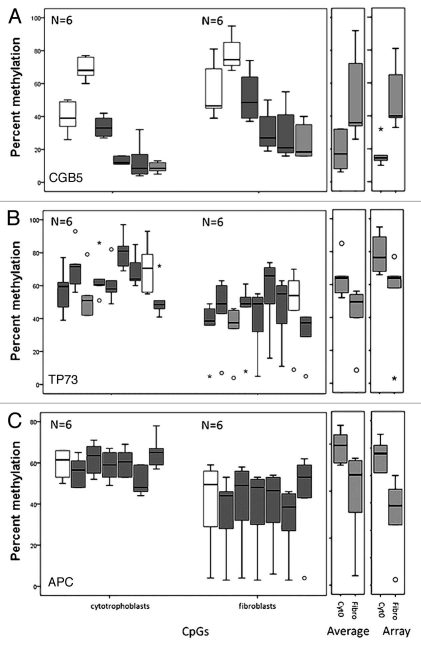
Figure 6.
Pyrosequencing validation of DNA methylation measured by microarrays. Three CpG sites mapping to the promoter region of (A) CGB5 and the tumor suppressor genes (B) TP73 and (C) APC were analyzed. For each gene three box plots are shown. From left to right: the first corresponds to the values for each CpG site as measured in the pyrosequencing assay, the second to the average of the values of all the CpG sites for each pyrosequencing assay and the third plot corresponds to the methylation value measured by the array. The white boxes correspond to non-statistically significantly different CpG sites and the grey boxes to statistically significantly different CpG sites between cytotrophoblast and fibroblast samples. The light grey boxes show the CpG of the pyrosequencing target that corresponds to the one that was targeted by the array.

