Figure 1.
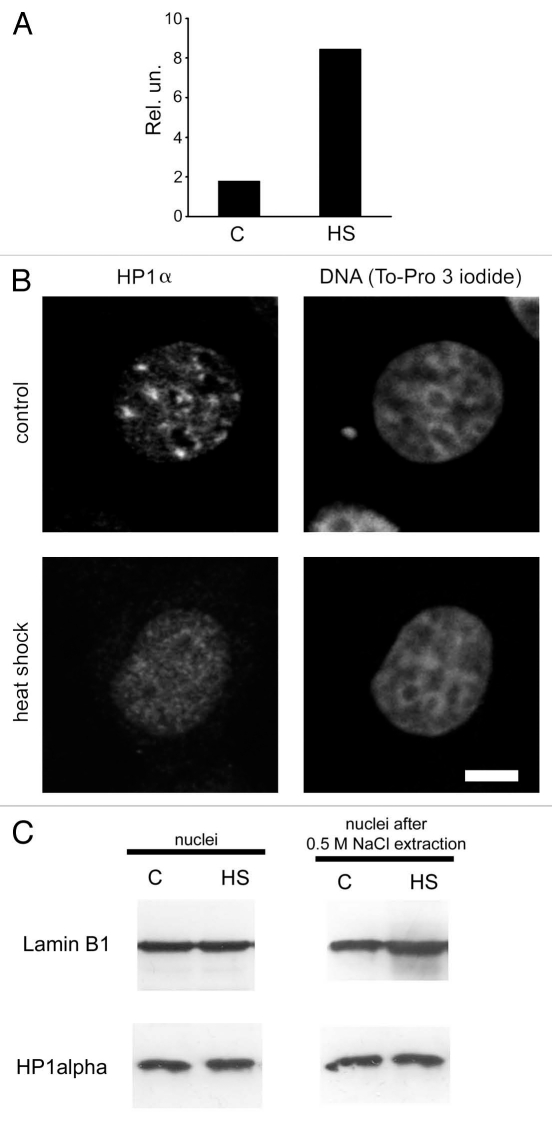
Redistribution of HP1α within the nucleus under heat shock conditions. (A) qRT-PCR analysis of hsp70 gene expression in control (untreated, C) and heat shock-treated (HS) MCF-7 cells. RNA extracted from treated and non-treated cells was reverse transcribed and the cDNA obtained was analyzed using a SYBR Green-based quantitative PCR approach. Amplification levels of hsp70 cDNA were normalized to the amplification level of GAPDH cDNA. Results of one representative experiment are shown. (B) Nuclear distribution of HP1α in control (untreated) and heat shock-treated cells. MCF-7 cells were immunostained with a mouse monoclonal antibody against HP1α and visualised by Alexa Fluor 488-conjugated anti-mouse IgG. DNA was stained with To-Pro 3 iodide fluorescent dye. Images were collected using a Leica laser scanning confocal microscope. Only one representative section is shown in each case. Bar scale: 5 µm. (C) Western blot analysis of HP1α in the nuclei (non-extracted and extracted with 0.5 M NaCl) of control (untreated, C) and treated with heat shock (HS) MCF-7 cells. Lamin B1 was used as a loading control.

