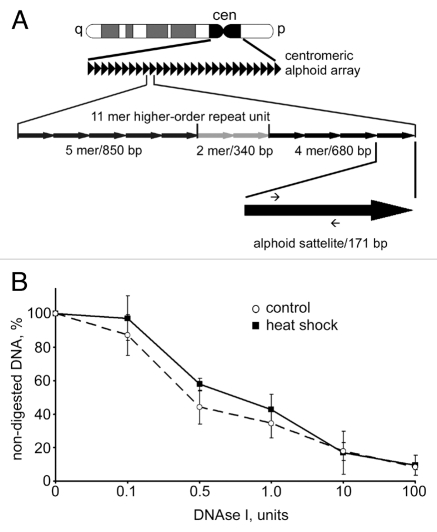
Figure 3.
DNAse I sensitivity of centromeric DNA did not change upon heat shock. (A) A scheme representing the principal organization of centromeric alphoid arrays (for details see text). Positions of primers used for qPCR are depicted as small arrows on the black arrow that represents an individual 171 bp alphoid satellite. (B) Dynamics of digestion of alphoid satellite DNA by DNase I in untreated MCF-7 cells (dashed line) and heat shocked MCF cells (black line). Aliquots (50 ng) of genomic DNA extracted from nuclei of MCF-7 cells digested with increasing amounts of DNase I were subjected to SYBR Green-based quantitative PCR analysis. The Ct values obtained were converted to DNA concentration using a standard curve (data not shown). DNase I sensitivity was expressed as a percentage of preserved template for amplification of an alphoid satellite test fragment (y-axis) and is plotted for varying DNase I concentrations (0–100 U; x-axis). The data shown are an average of four independent experiments. Error bars represent the standard deviation for each concentration.

