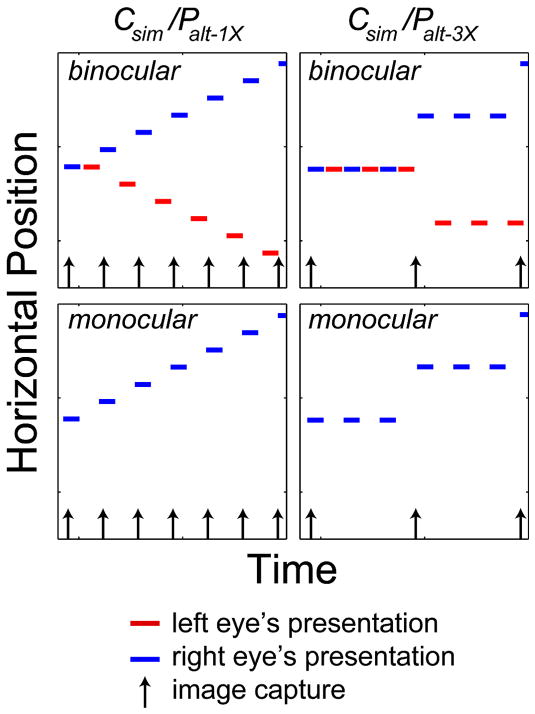
FIGURE 14.
Temporal protocols in the second set of measurements in Experiment 3. The stimulus again moved in depth. Panels plot the horizontal position of the stimulus presented to the eyes as a function of time. The left column represents the single-flash protocol Csim/Palt–1X and the right column the triple-flash protocol Csim/Palt–3X. The upper and lower rows schematize the stimuli for binocular and monocular presentation, respectively. The arrows indicate the times at which the stimuli were captured (or computed). The red and blue line segments represent the presentations of the images to the left and right eyes, respectively.

