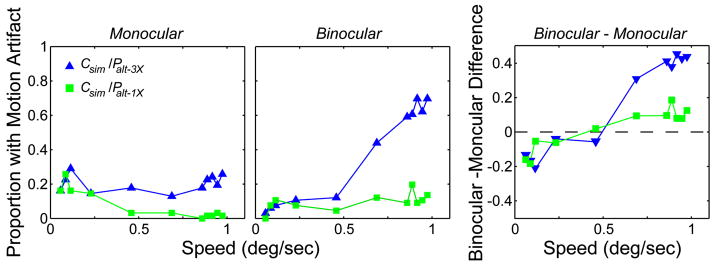
FIGURE 16.
Results from second set of measurements in Experiment 3. The stimuli are schematized in Fig. 14. The left and middle panels show the data for monocular and binocular presentations, respectively, averaged across observers. Those panels plot the proportion of trials in which motion artifacts were reported as a function of object speed in one eye. The green squares represent the data for the single-flash protocol (Csim/Palt–1X) and the blue triangles the data for the triple-flash protocol (Csim/Palt–3X). The right panel plots the difference between the binocular and monocular data (the proportion of artifact trials with binocular presentation minus the proportion with monocular presentation).

