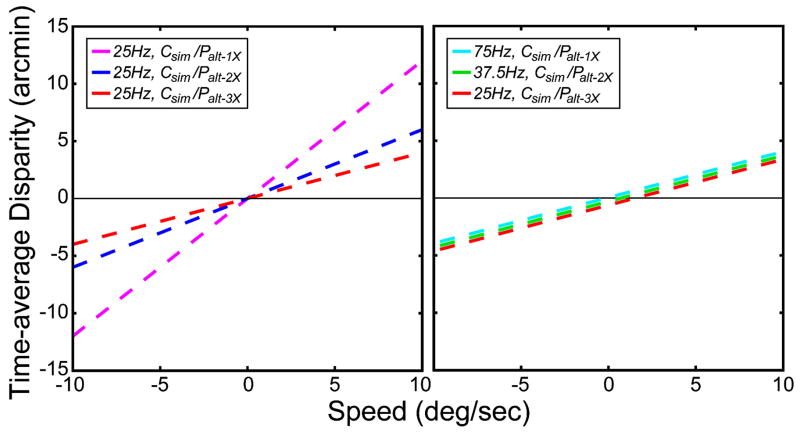
FIGURE 19.
Predicted distortions for some of the temporal protocols. Time-average disparity is plotted as a function of stimulus speed. The predicted nulling disparity (the disparity between the top of the plane of circles and the fronto-parallel plane when the circle plane appears fronto-parallel) is equal to the time-average disparity. In the left panel, the purple, blue, and red dashed lines are the predictions for the single-flash (Csim/Palt–1X), double-flash (Csim/Palt–2X), and triple-flash (Csim/Palt–3X) protocols when the capture rate is 25 Hz. In the right panel, the cyan, green, and red dashed lines are the predictions for protocols with a 75-Hz presentation rate: single-flash (Csim/Palt–1X) with 75-Hz capture, double-flash (Csim/Palt–2X) with 37.5-Hz capture, and triple-flash (Csim/Palt–3X) with 25-Hz capture. The lines actually superimpose, but have been vertically separated for clarity.

