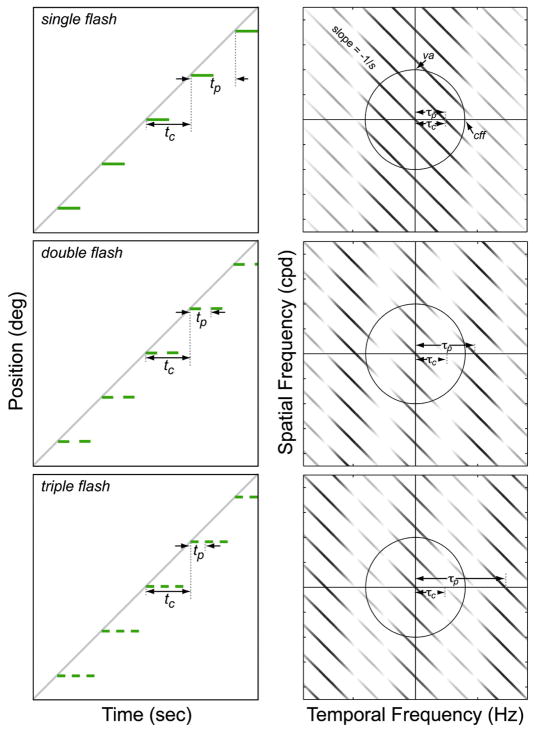
FIGURE 3.
Properties of stimuli presented with multiple-flash protocols. The left panels schematize the single-, double-, and triple-flash protocols. In each case, the same images are presented during the interval tc until updated images are presented in the next interval. In the multi-flash protocol, the duration of each image presentation tp is tc/f, where f is the number of flashes. Thus, tp = tc, tc/2, and tc/3 in single-, double-, and triple-flash protocols, respectively. The right panels show the corresponding amplitude spectra of the multi-flash stimuli plotted as a function of temporal and spatial frequency. The spectrum of a smoothly moving real stimulus would again be a diagonal line with slope −1/s. The presentation rate τp (or 1/tp) is indicated by arrows. The aliases are separated by τc (1/tc), which is also indicated by arrows. The circles represent the window of visibility defined by cff and va. The amplitudes of the aliases have been attenuated by ℑ[snf(x, t)], which is constant as a function of spatial frequency and oscillates as a function of temporal frequency.

