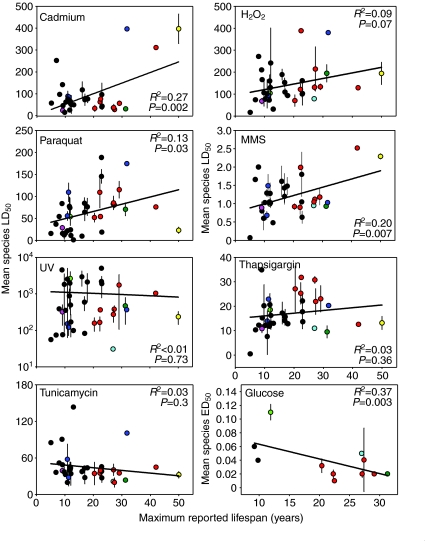
Fig. 1.
The association between species maximum lifespan and the mean LD50 or ED50 value for each of the test species. Each color indicates all individual species from a given order. Red, Anseriformes; purple, Apodiformes; blue, Charadriformes; green, Columbiformes; turquoise, Galliformes; black, Passeriformes; light green, Piciformes; yellow, Struthioniformes. Number of species and independent samples represented by each order are given in Table 1. Error bars are ±s.e.m. The lines show the outcome of a least squares regression. Pearson R2- and P-values reflect standard linear regression of maximum lifespan against mean LD50 or ED50 values for each species. Units are μM (cadmium, H2O2 and thapsigargin), mmol l–1 (MMS and paraquat), J m–2 (UV light), mg ml–1 (glucose) or μg ml–1 (tunicamycin).

