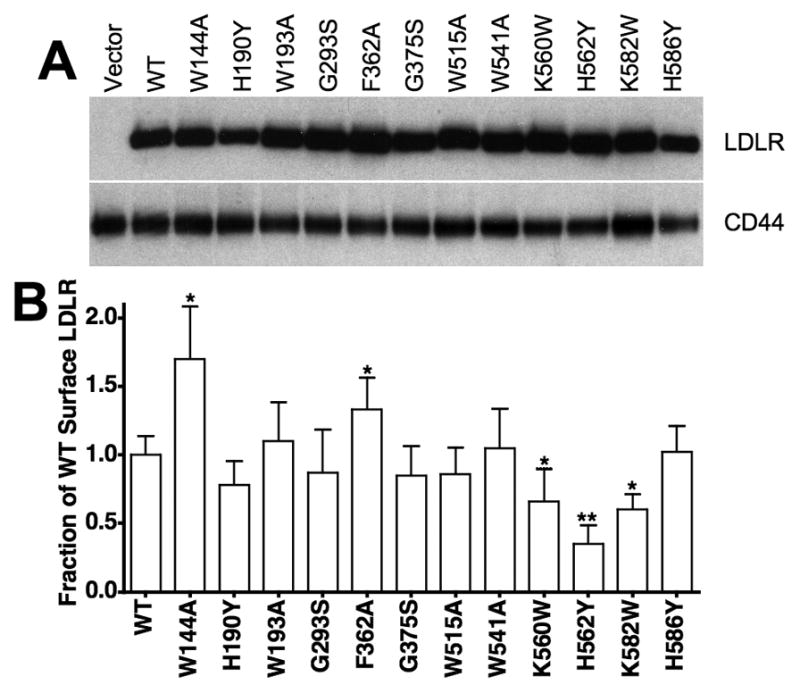
Fig. 2. Total and surface LDLR levels of cell lines.

LDLR−/− fibroblasts were infected with retroviruses encoding no LDLR (Vector), normal LDLR (WT) or LDLR variants W144A, H190Y, W193A, G293S, F362A, G375S, W515A, W541A, K560W, H562Y, K582W and H586Y. Panel A contains immunoblots of whole cell lysates showing relative total expression of LDLR with CD44 as a loading control. Relative surface expression (panel B) was determined by flow cytometry using the C7 monoclonal antibody to the LDLR ectodomain. Data presented in panel B are means ± one standard deviation of three independent determinations. In panel B, *indicates p<0.05 and **indicates p<0.001 relative to WT. H190Y trended lower, but did not reach 95% confidence (p=0.064).
