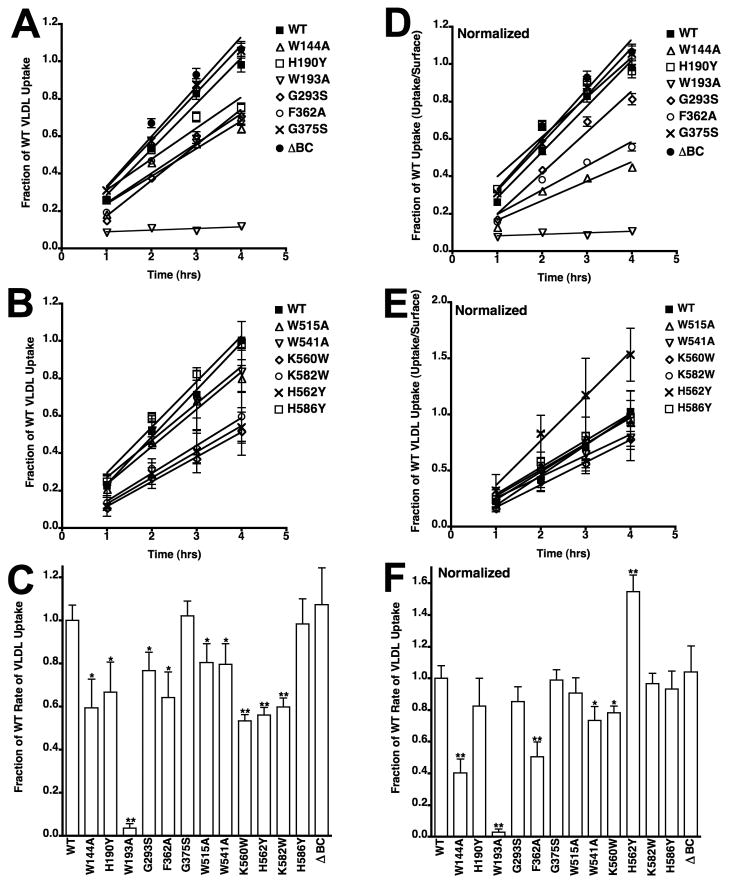
Fig. 4. β-VLDL uptake by cells expressing LDLR variants.
Cells expressing LDLR variants were incubated with 5 μg/ml Alexa546 labeled β-VLDL for the indicated times and analyzed as described in Figure 3. Panels A and B show the time courses of β-VLDL uptake over 4 hrs. Panel C shows the relative rate constants derived from the time courses in Panels A and B. Panels D, E and F show data from panels A, B and C that has been normalized to surface expression. All data is reported as the average of three determinations ± one standard deviation. In panels C and F, *indicates p<0.05 and **indicates p<0.001 relative to WT.

