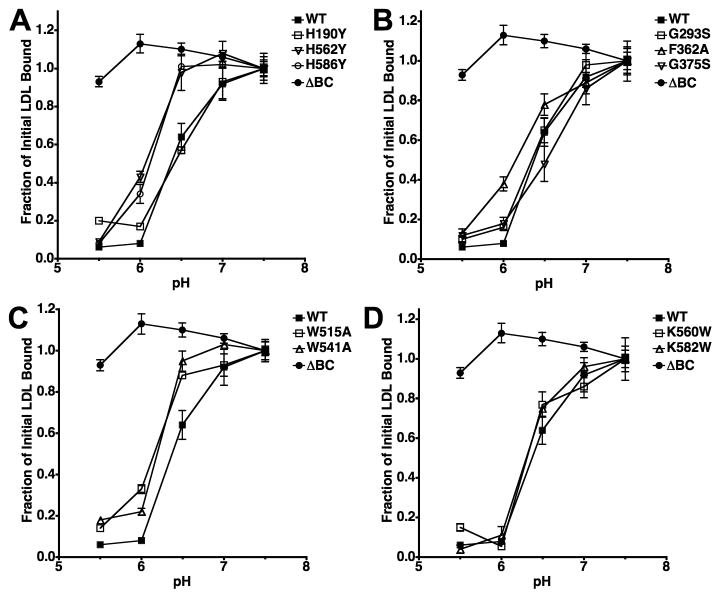
Fig. 5. Comparison of acid-dependent lipoprotein release.
Saturating amounts of 125I-LDL were bound to surface receptors of each variant and then cells were exposed to media of the indicated pH. The plots show the fraction of 125I-LDL that remained bound after the incubation. Assays using cells expressing the LDLR-ΔBC are shown as a negative control. Experiments were not conducted with cells expressing W144A and W193A because these cells did not bind LDL with normal affinity. Data presented is the mean ± one standard deviation of triplicate trials and is representative of three independent experiments.

