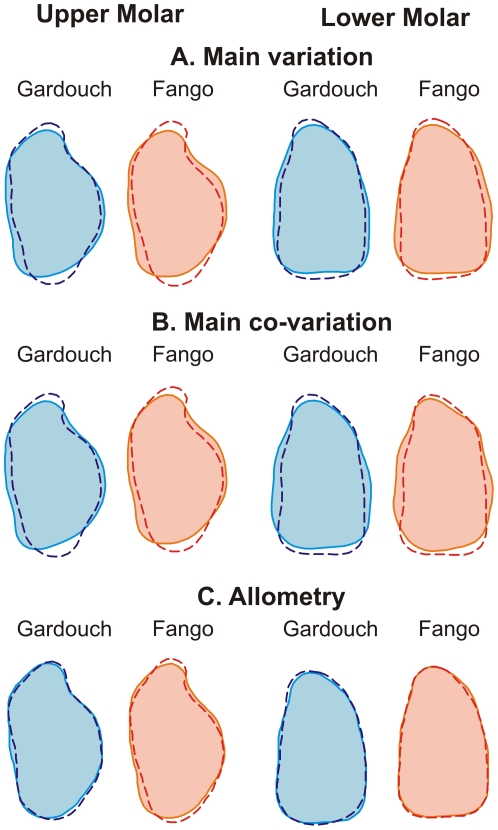
Figure 3. Main directions of shape changes in Gardouch (blue) and Fango (red).
(A) main intra-population variation, (B) intra-population co-variation and (C) allometry. (A) Shape changes along the direction of greatest variance (V1) corresponding to ±3×V1. (B) Co-variation between the first upper and first lower molars based on Partial Least Squares analyses corresponding to ±0.03 PLS1. (C) Allometric change in molar shape corresponding to a 20% size increase, based on the multivariate regression between size and shape.

