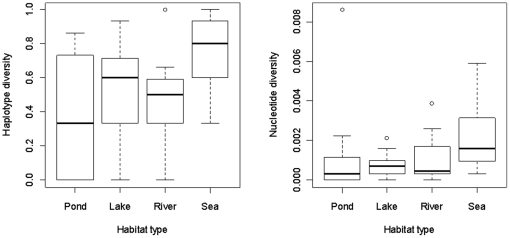
Figure 3. Box plots showing the distribution of haplotype and nucleotide diversity for each habitat type.
Outliers are shown with open circles, the range (excluding outliers) is marked by the upper and lower horizontal lines, the main boxes denote the inter-quartile range, and the heavy central lines show the medians.

