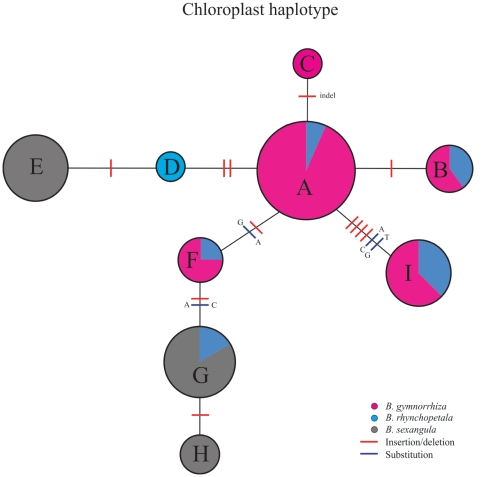
Figure 2. Statistical parsimony network of haplotypes A-I (see Table 4 ) obtained from combined chloroplast sequences of B. gymnorrhiza, B. sexangula, and B. × rhynchopetala individuals.
Sizes of circles are approximately proportional to the number of individuals with the given haplotype. Bars on lines between circles represent site changes between haplotypes under the statistical parsimony criterion.

