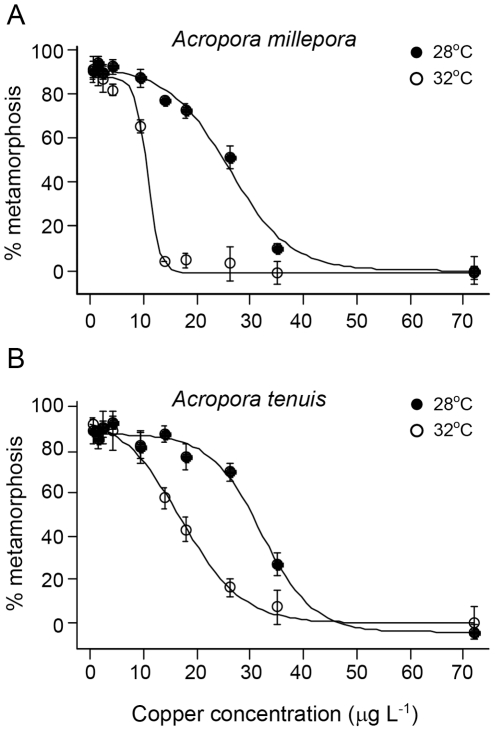
Figure 1. Relationship between larval metamorphosis and copper concentration for Acropora millepora (a) and Acropora tenuis (b).
Points represent the mean and standard error of measured % metamorphosis at each of two temperatures. Lines are the best-fit non-linear regressions of Equation 1 to each set of data.

