
Fig. 1.
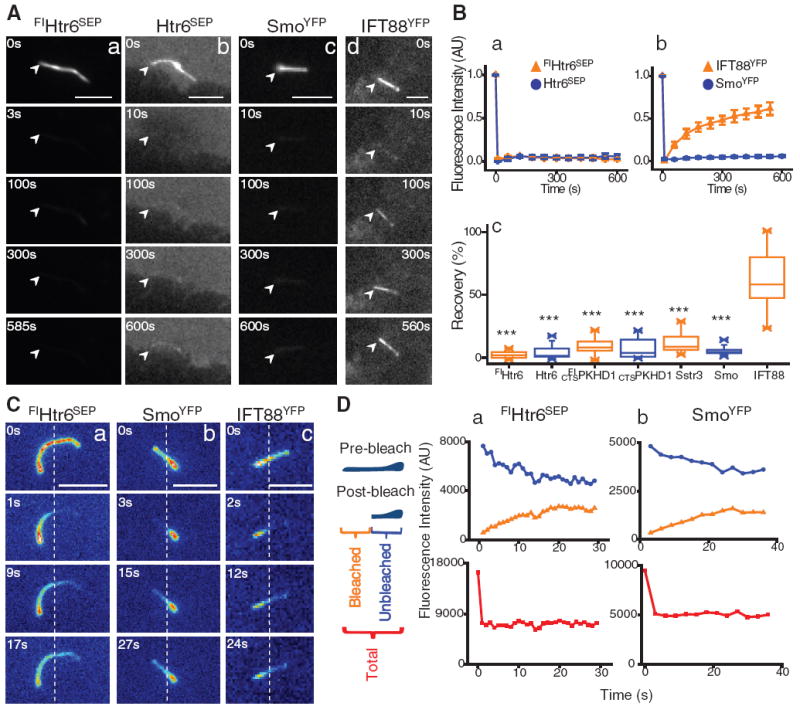
(A) FRAP of proteins in the whole cilium 24 hours after serum starvation. IMCD3 cells stably (a) or transiently (b) expressing Htr6SEP or IFT88YFP (d), and SmoYFP stably expressed in MEFs treated with 100 nM SAG for 24 hours (c); arrowheads mark one end of the cilium. Scale bars, 5 μm. (B) Kinetics of average (±SEM) fluorescence recovery of proteins photobleached in the whole cilium (a, b; n = 8 to 12). Summary of fluorescence recovery of ciliary membrane proteins as a percentage of the initial unbleached fluorescence level compared with IFT88YFP distribution (c; ***P < 0.0001). (C) FRAP of Htr6SEP (a), SmoYFP (b), and IFT88YFP (c) represented as heat-map images after photobleaching part of the cilium in IMCD3 cells; dotted lines mark the photobleached/unbleached boundary. Scale bars, 5 µm. (D) Representative example of kinetics of fluorescence recovery of photobleached region (orange curve), unbleached region (blue curve), and the two regions combined (red curve) of a primary cilium (n = 12 to 13).