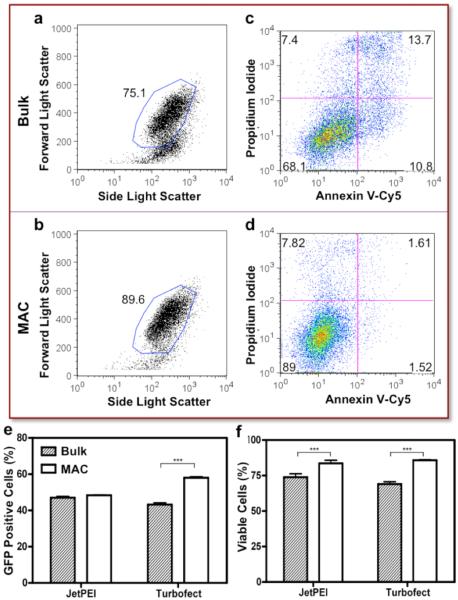
Figure 4. Quantification of Transfection Efficiency and Toxicity.
Consistent with the microscopic observation, (a, b) the FSC/SSC plot suggested that the MAC-prepared nanocomplexes induce minimum cell death (~96% cells were gated with untreated cells, data not shown). (c, d) Bivariate plots showing the fluorescence of PI and Annexin V-Cy5 staining were used to quantitatively evaluate cytotoxicity. Clearly, the bulk prepared nanocomplexes induced significant cell death (PI+) and apoptosis (PI−, Annexin V+). On the other hand, only minimum alteration of cell integrity was observed in the MAC counterparts. Quantification of (e) GFP expression level and (f) cell viability. Mean ± s.e.m. (n = 3). ***p<0.001 (Unpaired t-test, CI 95%, two-tailed p-value).

