
Figure 5.
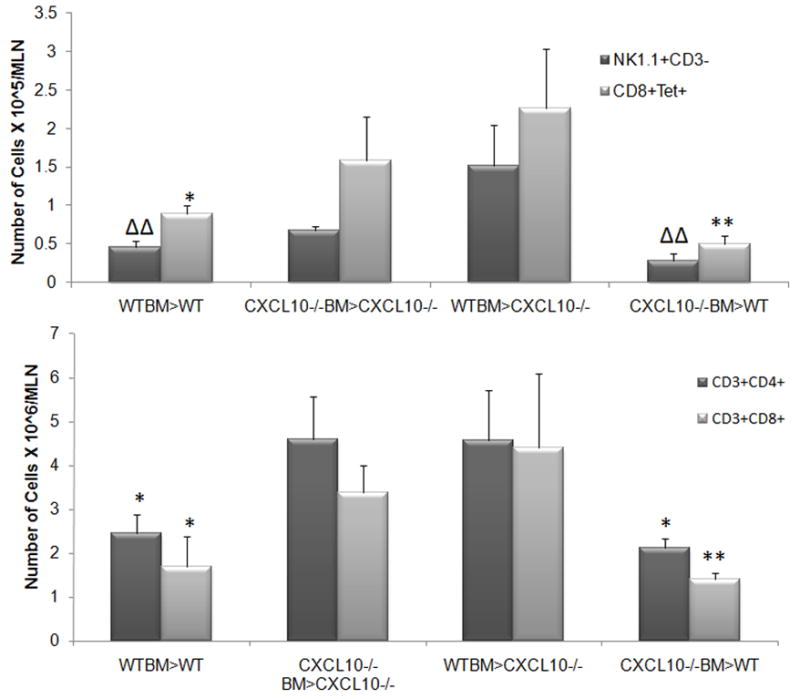
T cell populations are elevated in CXCL10−/− recipient chimeras. Mouse chimeras were infected with HSV-1 (1,000 PFU/eye). At day 7 PI, the mandibular lymph nodes (MLN) of exsanguinated mice were removed and processed for flow cytometry analysis. Bars represent the mean ± SEM, n = 5–9/group. **p<.01, *p<.05 comparing the indicated group to the CXCL10−/− recipient mouse chimeras. ΔΔp<.01 comparing the indicated group to the WTBM>CXCL10−/− mouse chimera.