Fig 1.

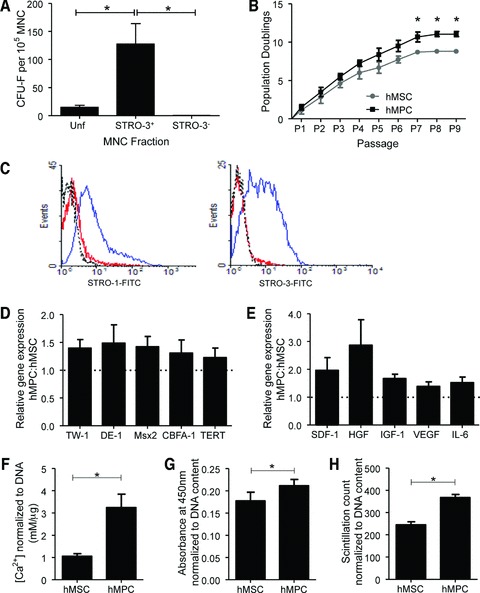
Biological comparisons between MSCs and MPCs. (A) The clonogenic efficiency of each MNC fraction. Results shown are the mean ± S.E.M. number of CFU-f per 105 cells plated for unfractionated (Unf), STRO-3+ and STRO-3−depleted (STRO-3−) MNC (*P < 0.001, average of five donor experiments). (B) Mean number of population doublings (±S.E.M.) of MSCs and MPCs during ex vivo culture from P0 to senescence (*P < 0.05, average of three donor experiments). (C) Examples of flow cytometric histograms comparing MPCs and MSCs from the same donor, for surface STRO-1 and STRO-3 expression at P4. Dotted line: isotype control. Red line: MSCs. Blue line: MPCs. P4 MPCs gene expression of various immature ‘stem cell’ markers (D) and cytokines (E). Results are presented as mean ratio ± S.E.M. of gene expression in MPC relative to MSC (average of three donor experiments). P4 MSC and MPC differentiation capacity for mineralization (F), adipogenesis (G) and glycosaminoglycan synthesis (H), under the respective in vitro inductive conditions. Data are presented as mean ± S.E.M. (*P < 0.05, average of three donor experiments).
