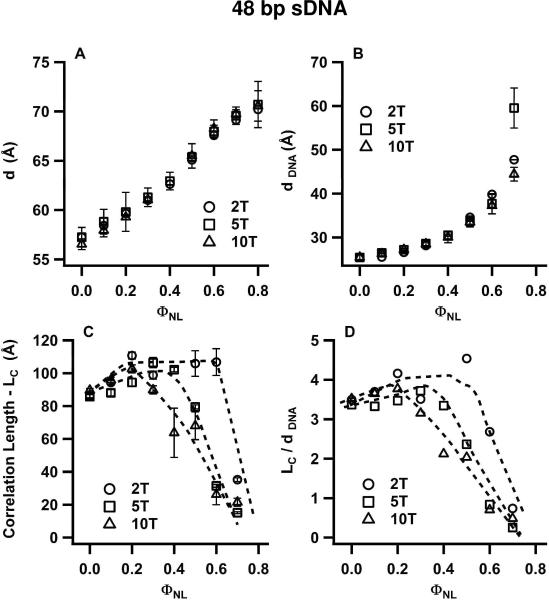
Figure 7.
Structural parameters of CL–sDNA complexes incorporating 48bp DNA-2T (open circles), 48bp DNA-5T (open squares) and for comparison 48bp DNA-10T (open triangles) from Fig. 5 as a function of ΦNL. The parameters result from line shape fits of the q002 and qsDNA peaks in the SAXS profiles of the corresponding complexes (incorporating 48bp DNA-2T and 48bp DNA-5T) with a double Lorentzian. The plots show the interlayer spacing d (A), the average spacing (dDNA) between sDNA molecules (B), the correlation length LC (C), and LC in units of dDNA (D). Similar to the data shown in Fig. 6 (for 24 bp DNA with 5-T and 2-T overhangs), both the correlation length and the range of ΦNL values for which LC/dDNA > 1 (indicative of the nematic phase) increase as the length of the non-sticky overhangs for 48 bp DNA is reduced from 10 T to 5 T and 2 T. This behavior results from the onset of sDNA end-to-end interactions.

