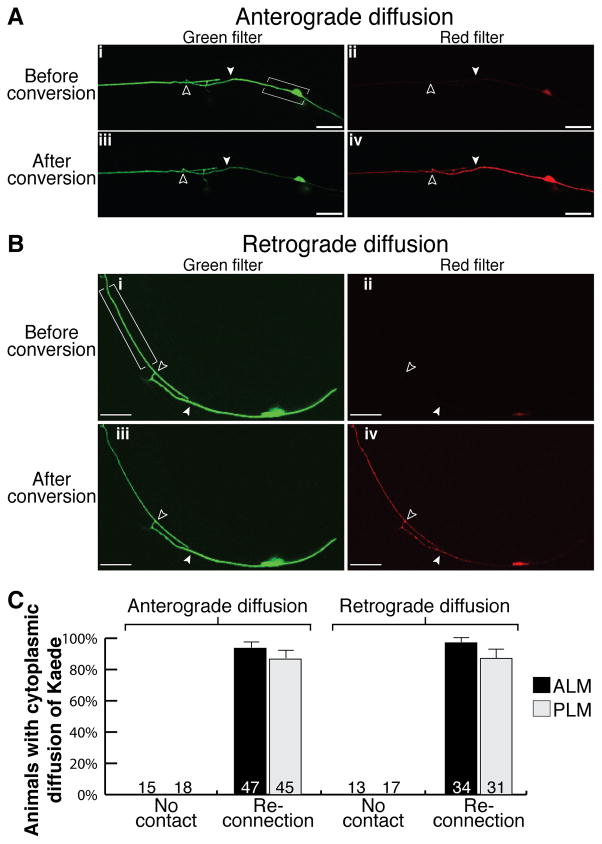
Figure 3.
Axonal fusion re-establishes cytoplasmic continuity. Kaede was converted in PLM in the bracketed regions 24 hrs post-axotomy to analyze anterograde (A) and retrograde (B) cytoplasmic diffusion. Representative images show green and red fluorescence before conversion in panels (i) and (ii), and after conversion in panels (iii) and (iv). Proximal-distal reconnection permitted anterograde (A) and retrograde (B) diffusion of red fluorescent Kaede across the site of axotomy (A,iv; B,iv). Filled arrowheads point to site of axotomy; open arrowheads show fusion site; scale bars: 25 μm. (C) Quantification of animals displaying either anterograde or retrograde diffusion of Kaede in the absence (no contact) or presence of reconnection for both ALM and PLM. Error bars: standard error of proportion; n values within each graph. Note the presence of a weak background signal before conversion through the red filter (A; B).

