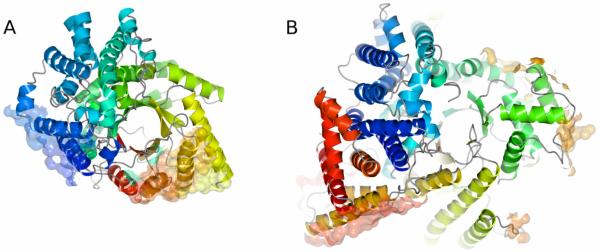
FIGURE 3.
A The surfaces of PepcA involved in tetramer formation are shown in semi-transparent, all-atom representation. The more extensive interface is at the lower right, and the smaller interface involving the C-terminal α-helices is at the left. The ribbon representing the protein is color-ramped from red at the N-terminus to dark blue at the C-terminus.
B The surfaces of Pepc involved in tetramer formation are shown in the same representation for the E. coli enzyme. The most extensive interface is at the lower left.

