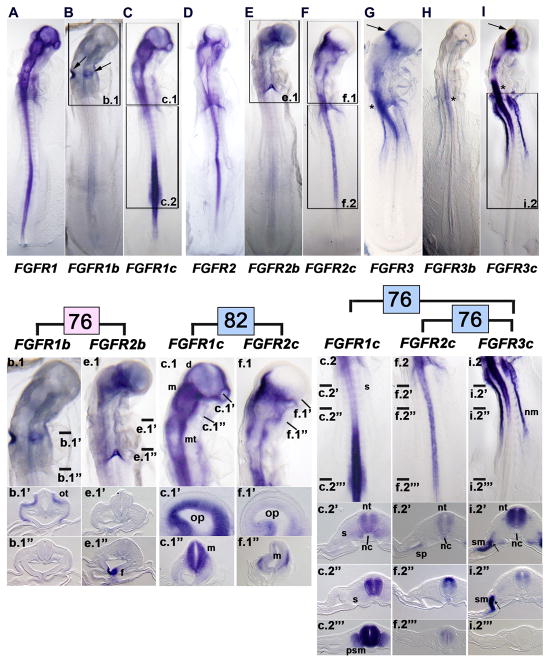
Figure 4. Whole mount in situ hybridization demonstrates the specificity of hybridization of FGF receptor isoform riboprobes in HH stage 13 embryos.
A, FGFR1, B, FGFR1b (the boxed area is shown at a higher magnification in b.1; arrows, expression of FGFR1b in the otic cups), and C, FGFR1c (the boxed areas are shown at a higher magnification in c.1 and c.2). b.1, Head region of the FGFR1b labeled embryo shown in B (transverse sections at the craniocaudal levels indicated by the lines are shown in b.1′ and b.1″). c.1, Head region of the FGFR1c labeled embryo shown in C (transverse sections at the craniocaudal levels indicated by the lines are shown in c.1′ and c.1″). c.2, Trunk region of the FGFR1c labeled embryo (transverse sections at the craniocaudal levels indicated by the lines are shown in c.2′, c.2″, and c.2‴). ot, otic cup; d, diencephalon; m, mesencephalon; mt, metaencephalon; op, optic vesicle; s, somite; nt, neural tube (spinal cord level); nc, notochord; psm, presomitic mesoderm (segmental plate mesoderm).
D, FGFR2, E, FGFR2b (the boxed area is shown at a higher magnification in e.1), and F, FGFR2c (the boxed areas are shown at a higher magnification in f.1 and f.2). e.1, Head region of the FGFR2b embryo shown in E (transverse sections at the craniocaudal levels indicated by the lines are shown in e.1′ and e.1″). f.1, Head region of the FGFR2c embryo shown in F (transverse sections along the indicated line are shown in f.1′ and f.1″). f.2, Trunk region of the FGFR2c labeled embryo shown in F (transverse sections at the craniocaudal levels indicated by the lines are shown in f.2′, f.2″, and f.2‴). f, expressing ventral midline of foregut (thyroid rudiment); op, optic vesicle; m, mesencephalon; nt, neural tube (spinal cord level); nc, notochord; sp, medial splanchnic mesoderm.
G, FGFR3 (arrow, strong expression at the border between the diencephalon and mesencephalon; asterisk, expression within the hindbrain/cranial spinal cord), H, FGFR3b, and I, FGFR3c (the boxed area is shown at a higher magnification in i.2′; arrow, strong expression at the border between the diencephalon and mesencephalon; asterisk, expression within the hindbrain/cranial spinal cord). i.2, Trunk region of the FGFR3c labeled embryo (transverse sections at the craniocaudal levels indicated by the lines are shown in i.2′, i.2″, and i.2‴). nm, nephrogenic mesoderm (nephrotome or intermediate mesoderm); nt, neural tube (spinal cord level); nc, notochord; sm, somatic mesoderm; arrows in i.2′ and i.2″ indicate nephrogenic mesoderm
Enlargements and sections are arranged to facilitate comparisons of expression patterns across the receptor family membranes that share the highest identity, indicated by the pink and blue numbers (74, 81, 77, and 72), as explained in Fig. 1C. In all combinations, differences occur in the patterns of expression as detailed in the text.

