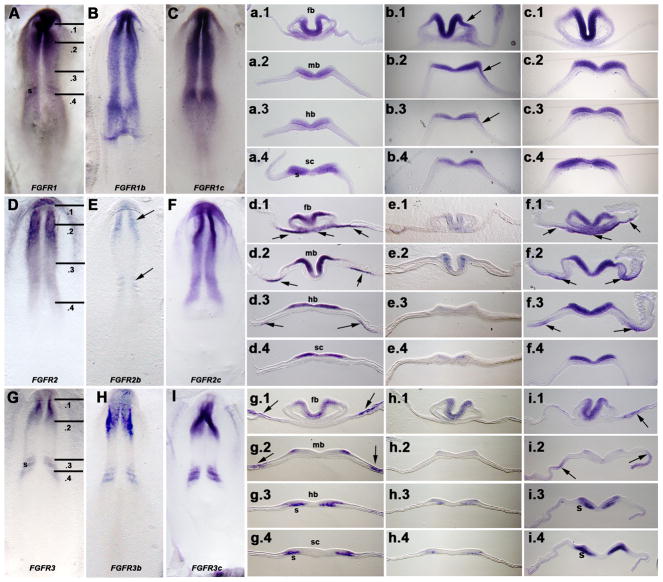
Figure 5. Whole mount in situ hybridization demonstrates similarity in the patterns of expression of FGF receptor isoforms in HH stage 7 embryos.
A, FGFR1, B, FGFR1b, and C, FGFR1c. Lines in A indicate section planes shown in a.1-a.4, b.1-b.4, and c.1-c.4. fb, forebrain level; mb, midbrain level; hb, hindbrain level; sc, spinal cord level. Arrow in b.3 indicates expression in the ectoderm of the future otic placode, which extends cranially to flank both the midbrain (b.2, arrow) and forebrain (b.1, arrow) levels.
D, FGFR2, E, FGFR2b (weak expression restricted to the cranial and caudal levels of neuraxis), and F, FGFR2c. Lines in D indicate section planes shown in d.1-d.4, e.1-e.4, and f.1-f.4. fb, forebrain level; mb, midbrain level; hb, hindbrain level; sc, spinal cord level. Arrows in d.1, d.2, d.3, f1, f.2, and f.3 indicate expressing areas of endoderm (and in some regions, also overlying tissue).
G, FGFR3, H, FGFR3b, and I, FGFR3c. Lines in G indicate section planes shown in g.1-g.4, h.1-h.4, and i.1-i.4. fb, forebrain level; mb, midbrain level; hb, hindbrain level; sc, spinal cord level; s, somite. Arrows in g.1, g.2, i1 and i.2 indicate expressing areas of ectoderm and/or underlying lateral plate mesoderm.

