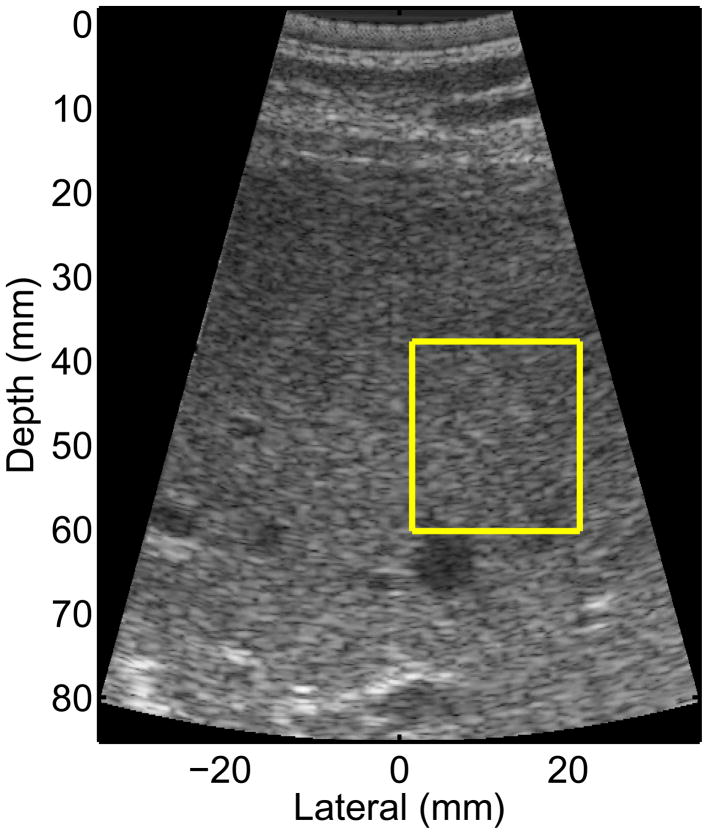
Figure 1.
B-mode image from one of the NAFLD study subjects. The yellow box represents the ROI for reconstructing the shear stiffness, which is chosen to be free of vessels and other liver substructures. The radiation force excitation was applied at a lateral position of 0, and propagation was monitored to the right (positive lateral locations).

