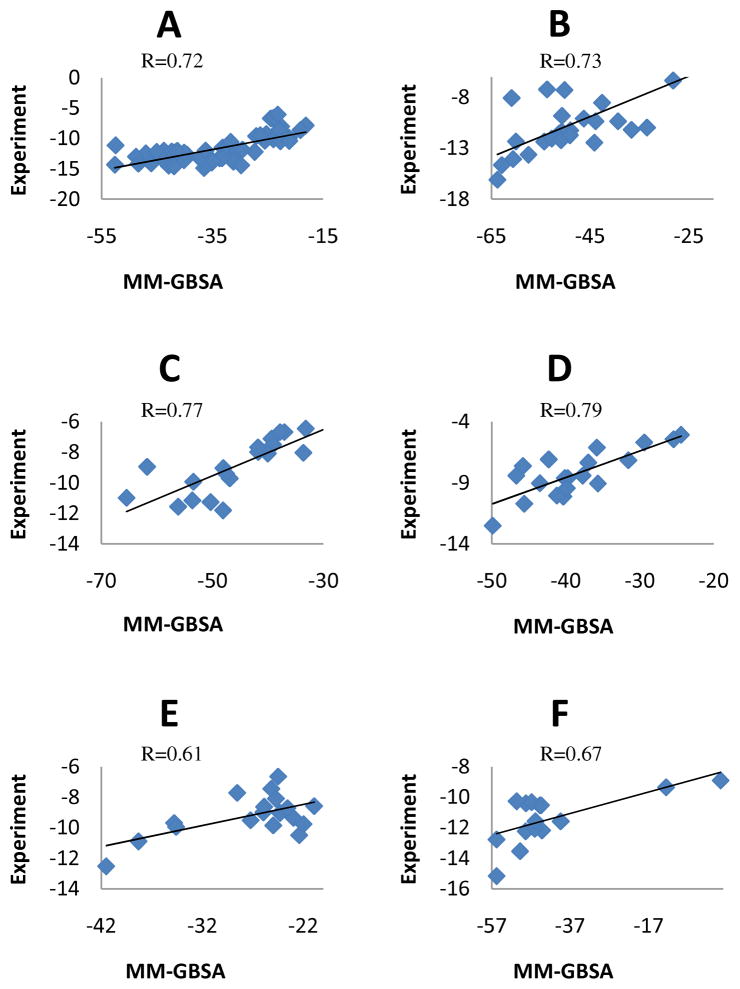
Figure 1.
Correlation between MM-GBSA predicted and experimental binding free energy. The R values shown in the figures are the Pearson product-moment correlation coefficients. The protein dielectric constant in MM-GBSA calculation was set to 4.0. A through F refer to the following protein targets, respectively: trypsin β, thrombin α, CDK+PKA, urokinase-type plasminogen activator, β-glucosidase A and coagulation factor Xa. The average standard deviations for MM-GBSA(MM-PBSA) calculations are 3.7(9.0), 2.0(5.6), 1.5(2.3), 1.4(2.0), 1.0(1.8) and 1.2(1.5) kcal/mol for trypsin β, thrombin α, CDK+PKA, urokinase-type plasminogen activator, β-glucosidase A and coagulation factor Xa, respectively.

