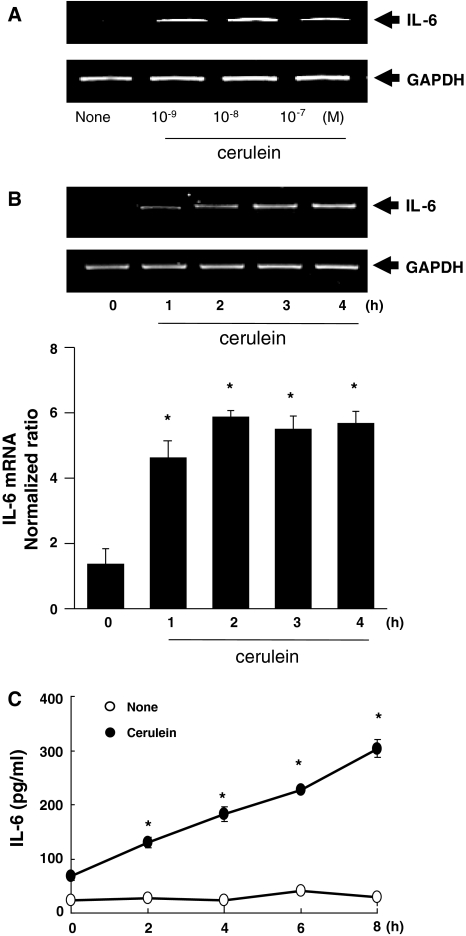
Fig. 1.
Time-dependent expression of IL-6 in cerulein-stimulated pancreatic acinar cells. Acinar cells were treated with various concentrations of cerulein (10−9–10−7M) for 3 h (a, mRNA expression by RT–PCR analysis). The cells were then stimulated with cerulein (10−8M) for the indicated time periods for mRNA expression analysis by RT–PCR (b, upper panel) and real-time RT–PCR analysis (b, lower panel). *P < 0.05 versus 0 h. c The amount of IL-6 released into the medium from cerulein-stimulated pancreatic acinar cells was determined by ELISA. The values are expressed as means ± S.E. of four different experiments. *P < 0.05 versus 0 h

