
Fig. 5.
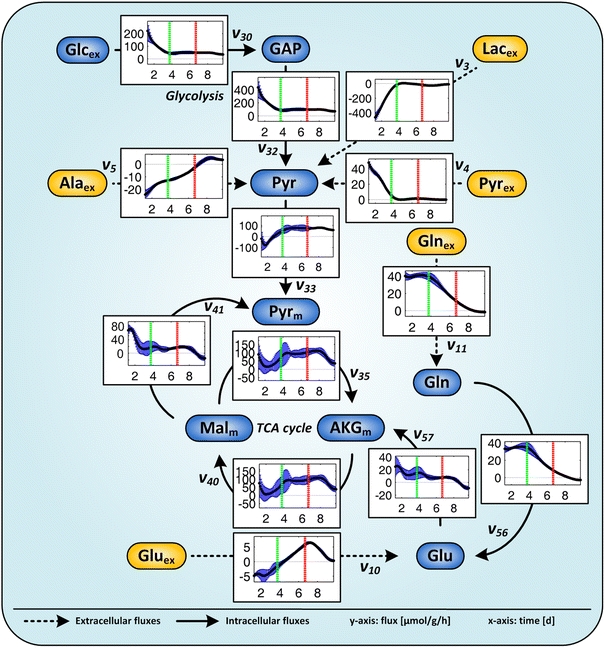
Selected metabolic fluxes of AGE1.HN over time related to biomass. Mean values and confidence intervals (90%) of four parallel cultivations. The fluxes (y-axis) are given in μmol g−1 h−1 and the time (x-axis) in days. The first line (90 h) indicates the end of the first metabolic phase when pyruvate is consumed, the second line (160 h) the end of the second metabolic phase when glutamine is consumed. Negative values indicate fluxes in the opposite direction of the arrow. Further extracellular and intracellular fluxes are depicted in Fig. S2 and Fig. S3 of the supplementary material