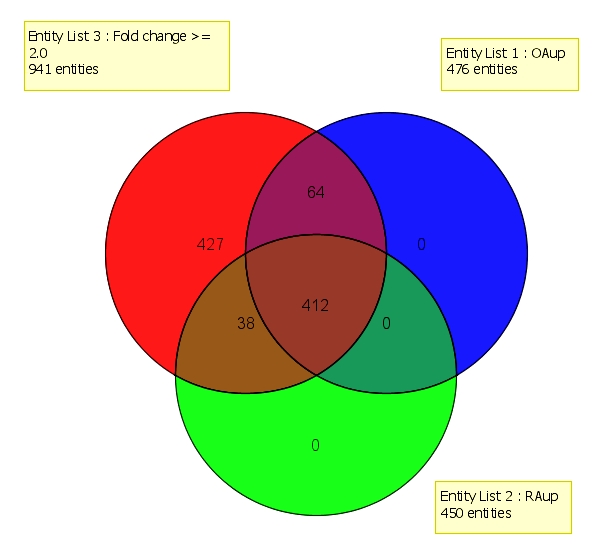
Figure 2.

Representation of number of genes up regulated in RA and OA (GSE1919) using Venn diagram. Entity List 1 represents up regulated genes associated with OA. Entity List 2 represents up regulated genes associated with RA. Entity List 3 represents all the up regulated genes obtained after filtration by fold change (cut off >> 2.0).
