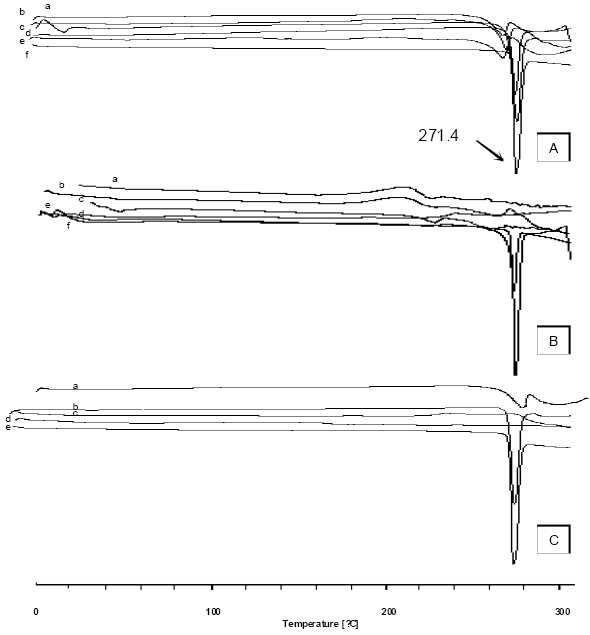
Fig. 2.

DSC thermogram of (A) microspheres of Eu RL; a) physical mixture F2, b) F1 (3:1 ratio) , c) theophylline d) F2 (4:1 ratio), e) F3 (5:1 ratio), f) Eu RL ( B) microspheres of CAB; a) F’1 (0.5:1 ratio) , b) F’2 (0.75:1 ratio), c) F’3? (1:1 ratio), d) physical mixture F’2, e) CAB, f) theophylline and (C) microspheres of mixture; a) Mix (1:0.5:0.5), b) physical mixture, c) Eu RL, d) CAB , e) theophylline.
