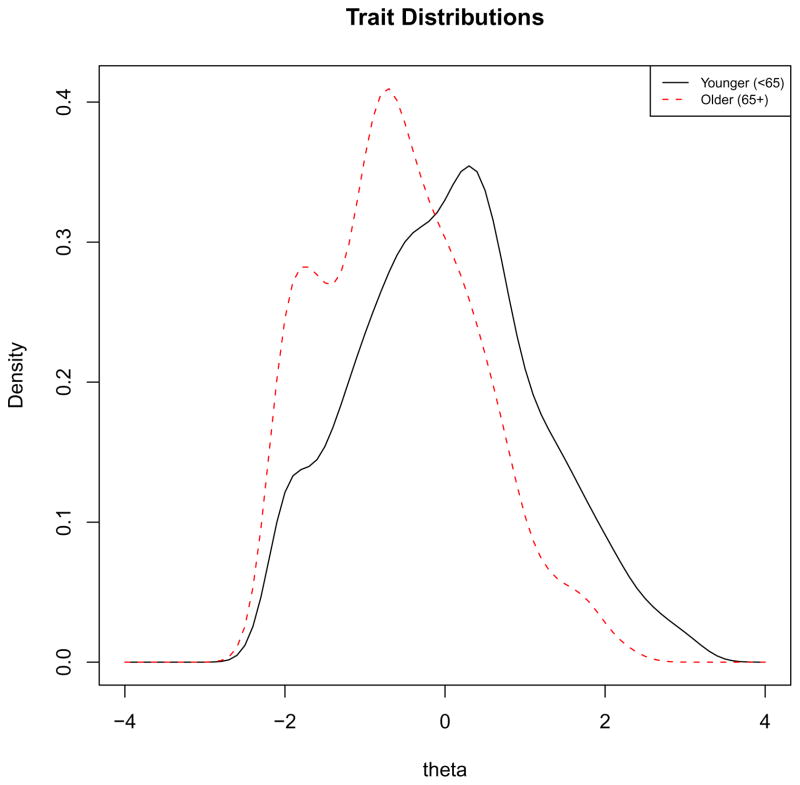
Figure 1.
Trait distributions – younger (< 65) vs. older (65 and up). Note: This graph shows smoothed histograms of the anxiety levels of older (dashed line) and younger (solid line) study participants as measured by the PROMIS Anxiety scale (theta). There is broad overlap in the distributions, though older individuals in general demonstrated lower levels of anxiety than younger individuals.

