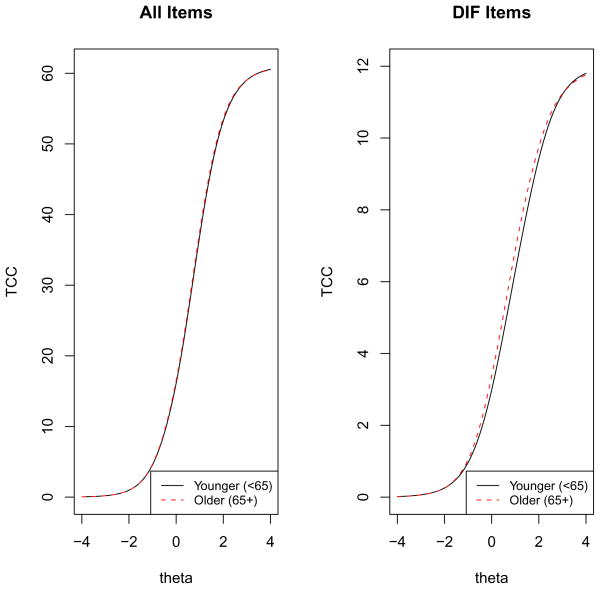
Figure 7.
Impact of DIF items on test characteristic curves. Note: These graphs show test characteristic curves (TCCs) for younger and older individuals using demographic–specific item parameter estimates. TCCs show the expected total scores for groups of items at each anxiety level (theta). The graph on the left shows these curves for all of the items (both items with and without DIF), while the graph on the right shows these curves for the subset of these items found to have DIF. These curves suggest that at the overall test level there is minimal difference in the total expected score at any anxiety level for older or younger individuals.

