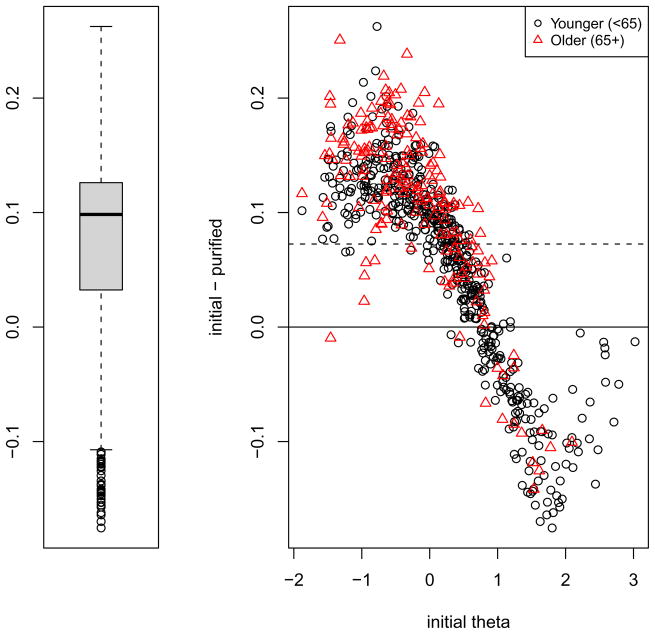
Figure 8.
Individual–level DIF impact. Note: These graphs show the difference in score between using scores that ignore DIF and those that account for DIF. The graph on the left shows a box plot of these differences. The interquartile range, representing the middle 50% of the differences (bound between the bottom and top of the shaded box), range roughly from +0.03 to +0.12 with a median of approximately +0.10. In the graph on the right the same difference scores are plotted against the initial scores ignoring DIF (“initial theta”), separately for younger and older individuals. Guidelines are placed at 0.0 (solid line), i.e., no difference, and the mean of the differences (dotted line). The positive values to the left of this graph indicate that in almost all cases, accounting for DIF led to slightly lower scores (i.e., naive score ignoring DIF minus score accounting for DIF > 0, so accounting for DIF score is less than the naive score) for those with lower levels of anxiety, but this appears to be consistent across older and younger individuals. The negative values to the right of this graph indicate that for those with higher levels of anxiety, accounting for DIF led to slightly higher scores, but this again was consistent across older and younger individuals.

