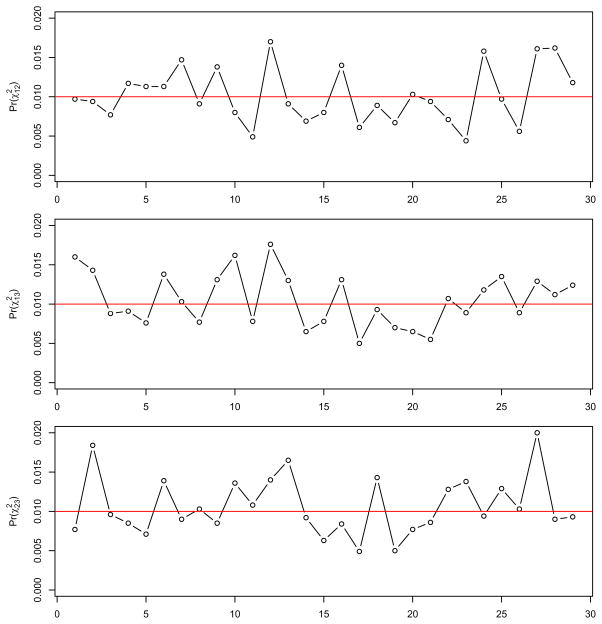
Figure 9.
Monte Carlo thresholds for χ2 probabilities (1,000 replications). Note: The graphs show the probability values for each of the items (shown along the x–axis) associated with the 99th quantile (cutting the largest 1% over 1,000 iterations) of the χ2 statistics generated from Monte Carlo simulations under the no DIF condition (data shown in Table 1). The lines connecting the data points are placed to show the uctuation across items and not to imply a series. The horizontal reference line is placed at the nominal alpha level (0.01).

