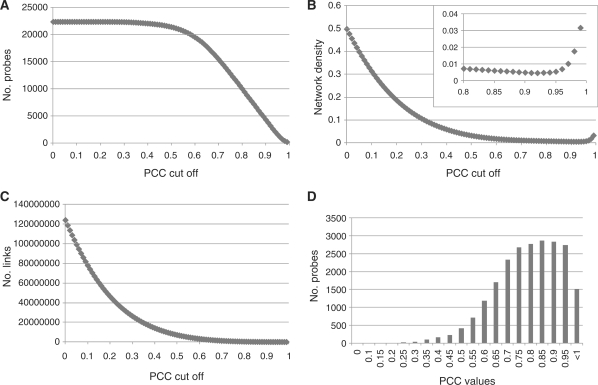
Fig. 1.
Overview of the global features of the barley co-expression network. The number of probes and links, and network density were calculated along with the wPCC cut-off from 0 to 0.99 with an interval of 0.01. Network density is calculated by dividing the number of observed links by the number of possible maximum links. (A) The number of probes in the entire network at the positive PCC cut-off value. (B) The number of links in the entire network at the positive PCC cut-off value. (C) Network density in the entire network at the positive PCC cut-off value. The boxed plot shows a magnification of the area from the PCC cut-off range from 0.8 to 0.99. (D) Distributions of PCC values between each probe and its probes of strongest co-expressed gene.

