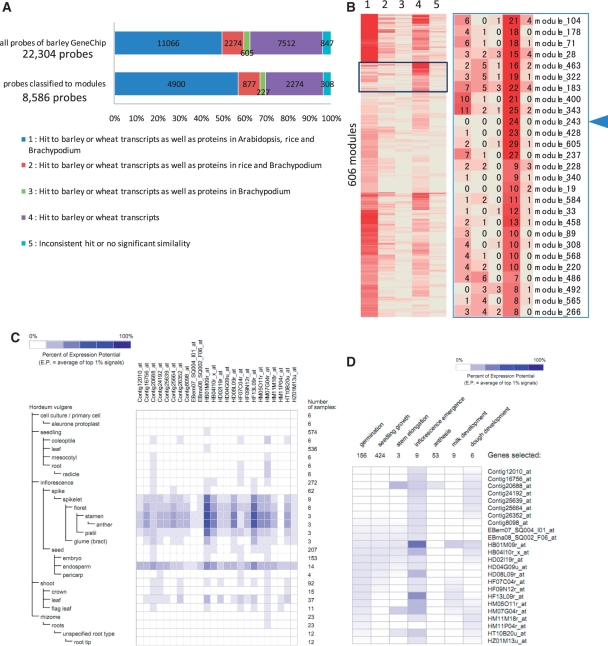
Fig. 5.
Identification of putative lineage-specific network modules. (A) A bar graph showing numbers and proportions of the probes for all probes analyzed (22,043) and probes classified in modules (8,586). The graph indicates significant similarity among transcripts of barley and wheat, and/or proteins of Arabidopsis, rice and Brachypodium. The hit patterns in the similarity search are classified into five categories; (1) hit to barley or wheat transcripts as well as proteins of Arabidopsis, rice and Brachypodium, (2) hit to barley or wheat transcripts as well as proteins of rice and Brachypodium, (3) hit to barley or wheat transcripts as well as proteins of Brachypodium, (4) hit to barley or wheat transcripts and (5) inconsistent hit or no significant similarity. (B) A heat map representing the number of probes that are classified into the five categories described in A in each of 606 modules, which are hierarchically clustered for identification of modules consisting of probes of genes, which are putatively lineage specific. The magnified image of the boxed area shows modules, each of which abundantly include probes of Triticeae-specific genes (category 4). Each number shown in each cell indicates the number of probes assigned to each category in each module. The arrowhead indicates module 243, which consists of 24 probes of putative Triticeae-specific genes. (C) The heat map visualization of gene expression patterns from Genevestigator on members in module 243 in anatomical barley tissues and (D) in developmental stages.

