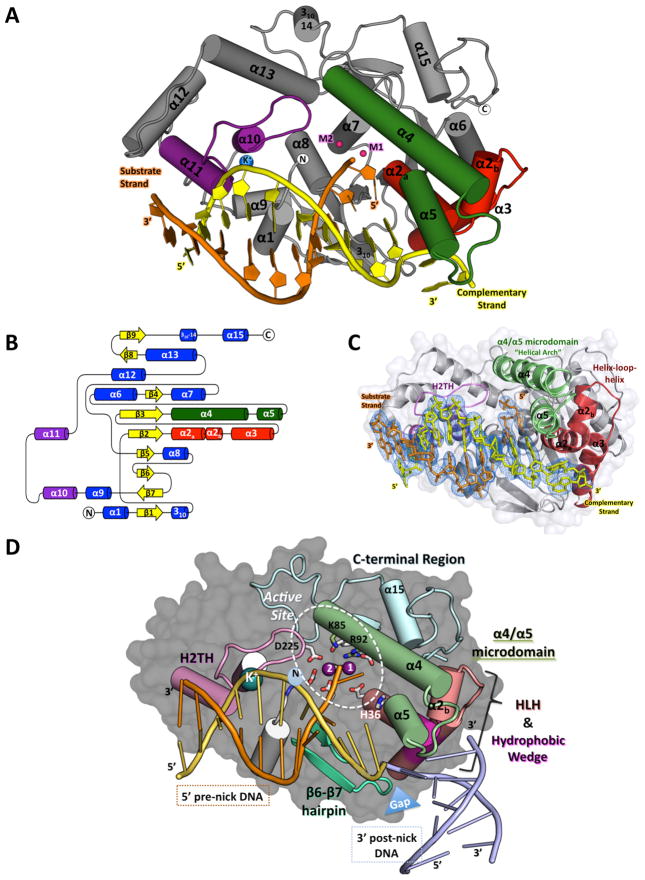
Figure 1. Structure of the hExo1 catalytic domain in complex with a 5′-recessed end substrate.
(A) Structure of the hExo1 catalytic domain bound to a gapped DNA substrate mimic. Conserved DNA binding motifs are indicated: α4-α5 micro-domain (“helical arch”), green; α2-α3 helix-loop-helix, red; K+ ion-binding site (blue) in helix-two-turn-helix (H2TH), purple. Two active-site metal ions are shown (red).
(B) Topology map of secondary structure elements in the hExo1 catalytic domain.
(C) Simulated-annealing omit electron density map calculated to 2.5 Å resolution contoured at 1σ around DNA of the hExo1 D173A complex. Note the ~90° bend of the 3′ complementary DNA strand. DNA binding motifs are colored as in A.
(D) Key functional features of the of hExo1-DNA complex. DNA binding motifs are colored as in B. C-terminal region is blue; hydrophobic wedge region of α2-α3 is shown in magenta; β6-β7 hairpin is teal. hExo1 DNA substrate is orange and yellow; modeled post-nick DNA from A. fulgidus FEN-1 structure (PDB 1RXW) is blue. A gap between the pre- and post- nick region is highlighted with a blue triangle. Active site residues are shown as sticks. Mn2+ (magenta) and K+ ions (blue) are highlighted. See also Figure S1.

