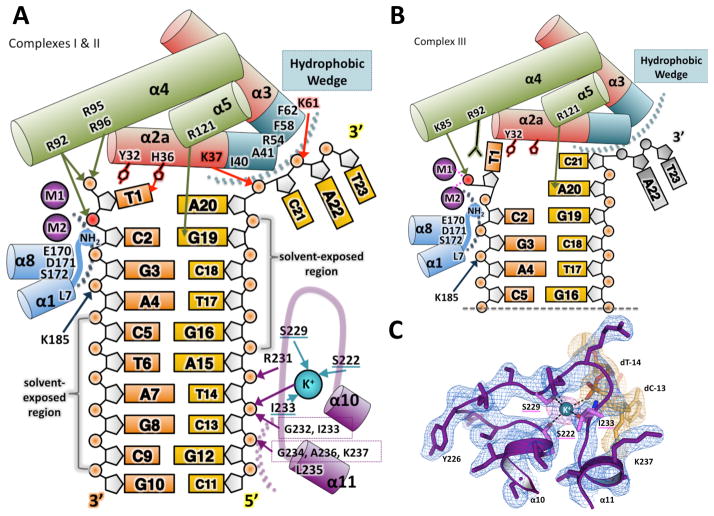
Figure 3. Interactions between the hExo1 protein and DNA substrate.
(A) Schematic of interactions between hExo1 and DNA in the complex I and II (nascent substrate) structures, colored as in Figure 1A. The hydrophobic wedge is at the ends of α2 and α3 (teal). The scissile phosphodiester bond is red. Hydrogen bonds between DNA substrate and protein side chains are indicated with arrows: main-chain hydrogen bonding residues are boxed. Residues coordinating K+ are underlined in teal; van der Waals contacts are indicated by dotted arcs.
(B) Schematic of interactions between hExo1 and DNA in product structure (complex III). Two active site metals and K85 coordinate the terminal phosphate. The terminal base is flipped. Disordered nucleotides A22 and T23 on the complementary strand are modeled in grey.
(C) The K+-binding site in the H2TH domain. The composite omit 2Fo-Fc electron density for the protein (blue) and the DNA density (orange) is contoured at 1σ. An anomalous difference Fourier map (magenta) of the Ba2+-substituted complex is superimposed (5σ contour). See also Figure S2.

