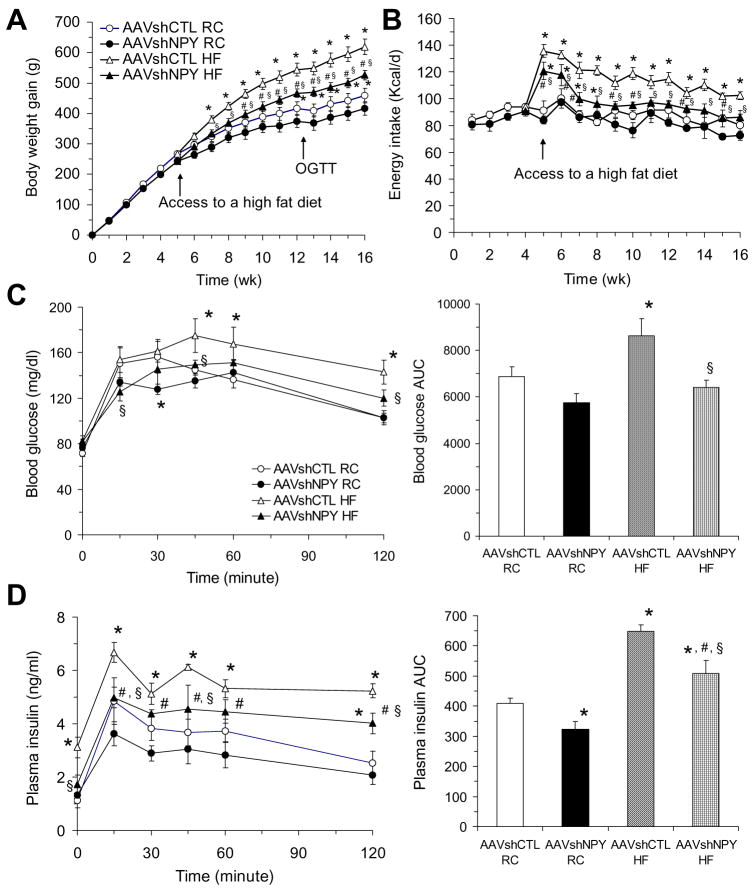
Figure 2.
Effects of DMH NPY knockdown on food intake, body weight, and glucose tolerance. (A) Body weight gain in AAVshCTL and AAVshNPY rats with access to a regular chow (RC) or high fat (HF) diet. OGTT, time of oral glucose tolerance test. (B) Daily food intake in the four groups of rats. (C) Blood glucose response to oral glucose administration. AUC indicates the area under the curve. (D) Plasma insulin response to oral glucose administration. Values are means ± SEM. n = 6 rats per group. *P<0.05 compared with AAVshCTL RC rats, #P<0.05 compared with AAVshNPY RC rats and §P<0.05 compared with AAVshCTL HF rats.

