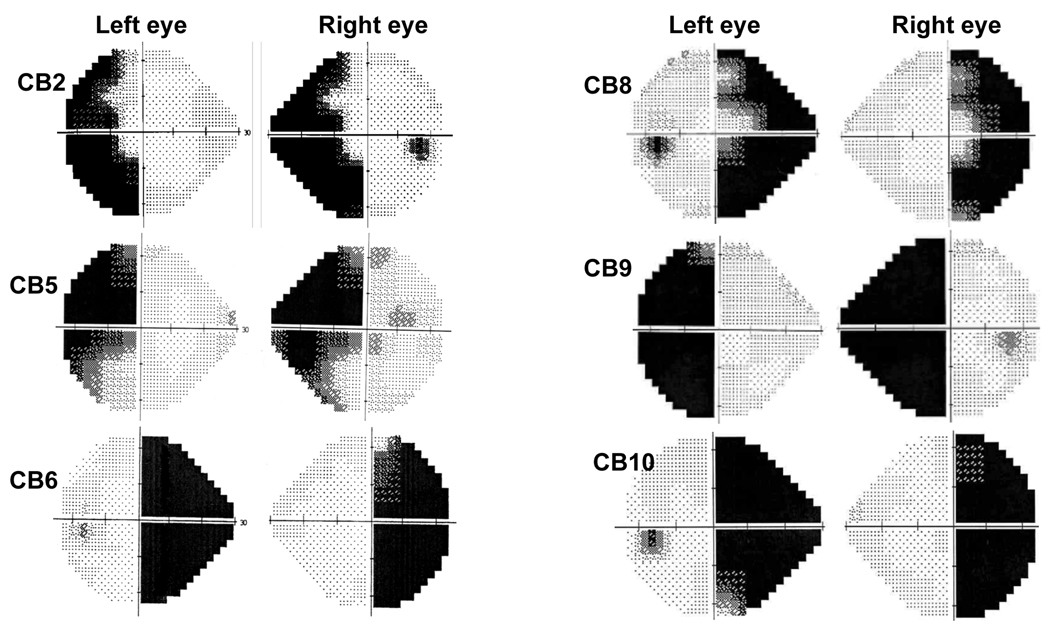
Figure 1.
24-2 Humphrey visual fields illustrating the visual field defects in each of the six cortically blind subjects tested in the present study. The dark regions indicate areas of deficit over the central 25° of vision in each eye. For an indication of the full extent of the defect over the entire visual field of each eye, refer to the Goldmann Visual fields in Supplementary Figure 1.

