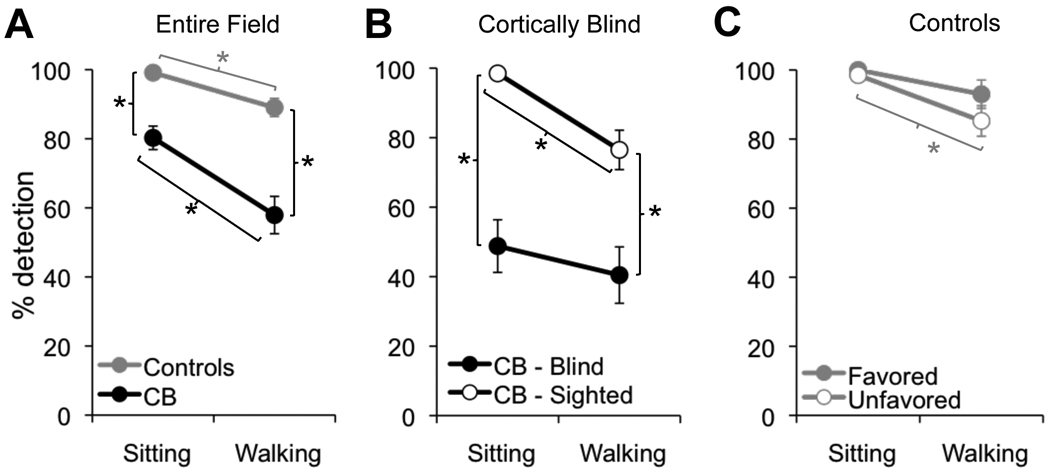
Figure 4. Effect of vision loss on basketball detection.
A. Plot of the percentage of basketballs detected across the entire visual field by control and cortically blind (CB) subjects, as a function of condition (sitting or walking). B. Plot contrasting basketball detection rates for balls originating in the sighted and blind hemifields of cortically blind (CB) subjects. C. Basketball detection rates plotted separately for the favored and unfavored hemifields of controls. Error bars = SEM, * = p<0.05.

