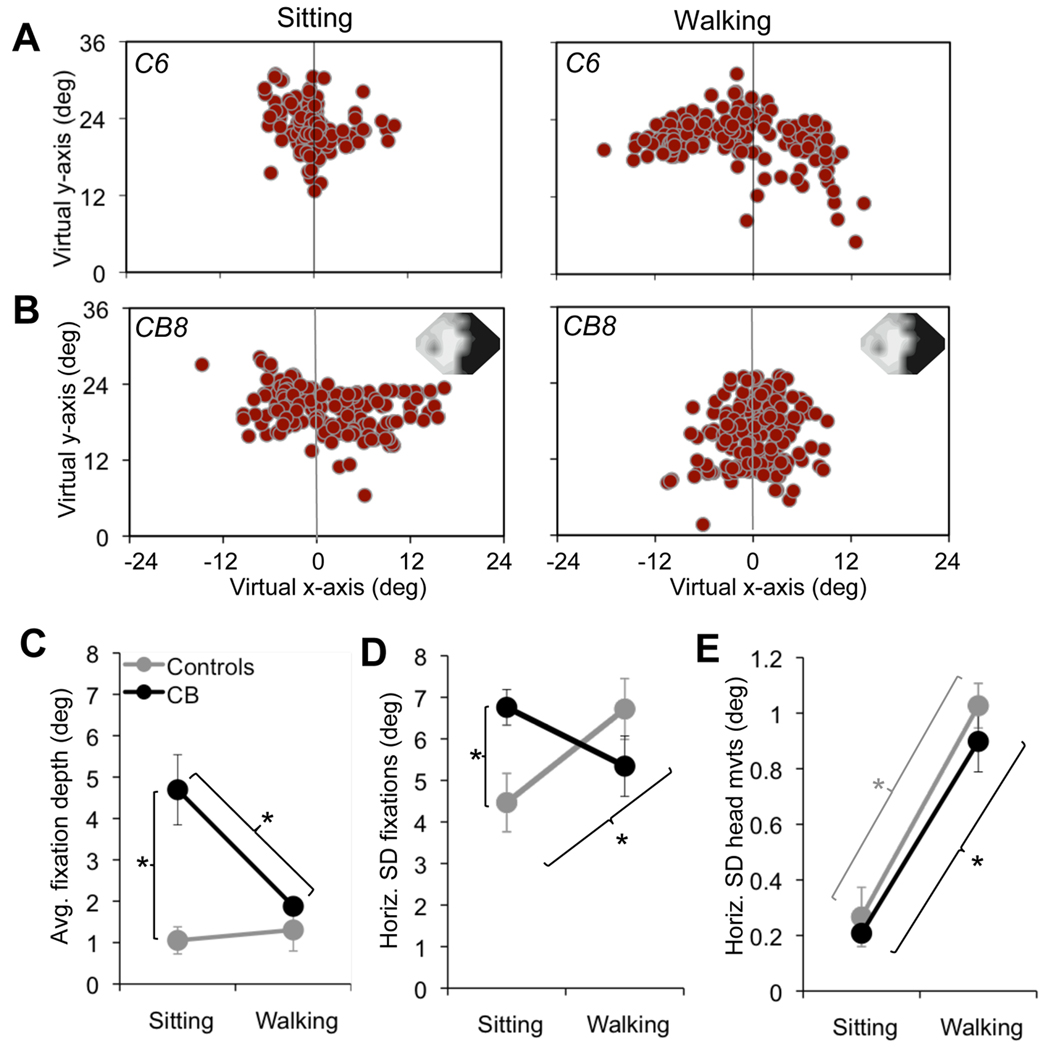
Figure 5. Effect of vision loss on fixation and head movement parameters.
A. Plot of fixation distribution for one control participant under each of the two experimental task conditions tested – sitting and walking the L-shaped path. The vertical gray line in each graph denotes the vertical midline or meridian of the virtual field of view. Note the relatively well-centered distribution of fixations under both conditions in this subject, and the greater horizontal spread of fixations in the walking relative to the sitting condition. B. Plots of fixation distribution in one cortically blind participant, for each of the two experimental task conditions tested. The subject’s 24-2 Humphrey visual field composite (averaged across both eyes) appears in the upper right corner, with the black regions representing the visual deficit (<5dB of sensitivity) and light gray and white representing intact vision (~20–30dB sensitivity). Note the propensity of this cortically blind subject to place the majority of his fixations into the virtual hemifield corresponding to the side of his visual defect. In addition, there is a relatively broad horizontal distribution of fixations in the sitting condition, which is decreased in the walking condition. C. Magnitude of horizontal fixation bias represented as the average horizontal fixation position (depth) relative to the vertical meridian of the virtual field of view, plotted as a function of condition (sitting or walking) for the two subject groups (controls and cortically-blind). D. Plot of the average standard deviation (SD - an indication of spread) around the mean fixation location as a function of condition. E. Average horizontal standard deviation (SD) of head movements over a one-minute period, plotted as a function of condition. All error bars = SEM, * p<0.05.

