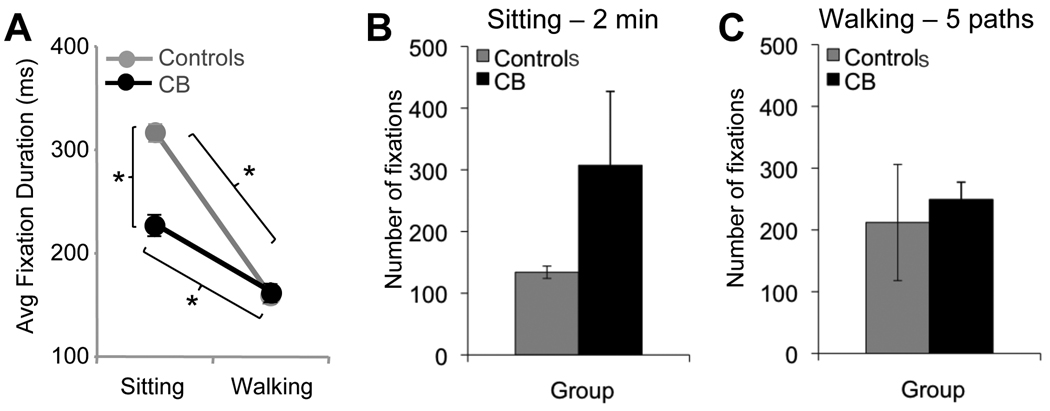
Figure 6. Effect of vision loss on fixation duration and number of fixations.
A. Plot of average fixation durations for control and cortically blind subjects as a function of condition (sitting or walking) across the entire visual field. B. Number of fixations in the sitting condition over a two-minute period for the control and cortically blind subjects. C. Number of fixations in the walking condition, counted over the first 5 paths completed by each subject group. Error bars = SEM, * = p<0.05.

